| Contract Management Benchmarking: Sample Report |
|
|
Contract Management Benchmarking Survey 2021 SCMG are managing the benchmarking survey for the eleventh year in 2021. Each participant who completes the survey will be provided with a benchmarking report that will compare their contract management performance against best practice. This includes a quantitative assessment and maturity grids that explain the scoring system and the typical characteristics of businesses and organisations who demonstrate traditional, transitional or best practice performance. Participants will also be able to see their performance score against the average, minimum and maximum scores for each element and category in the model. All data and information provided is securely held and your bespoke benchmark report will only be provided to you. Participants can also join Best Practice groups and participate further developing best practice contract management techniques. These groups meet on a regular basis to develop and share ideas to improve contract performance. Participants will also be able to access the Participant Zone of the website to share case studies and access other reports and presentations. Unlike many other Benchmarking exercises there is no charge to participate or receive your report. |
|
|
Sample Report Each individual report benchmarks the participants performance against the rest of the group. Pages from a sample report are reproduced below to provide a flavour of the information provided within each participant's report. |
|
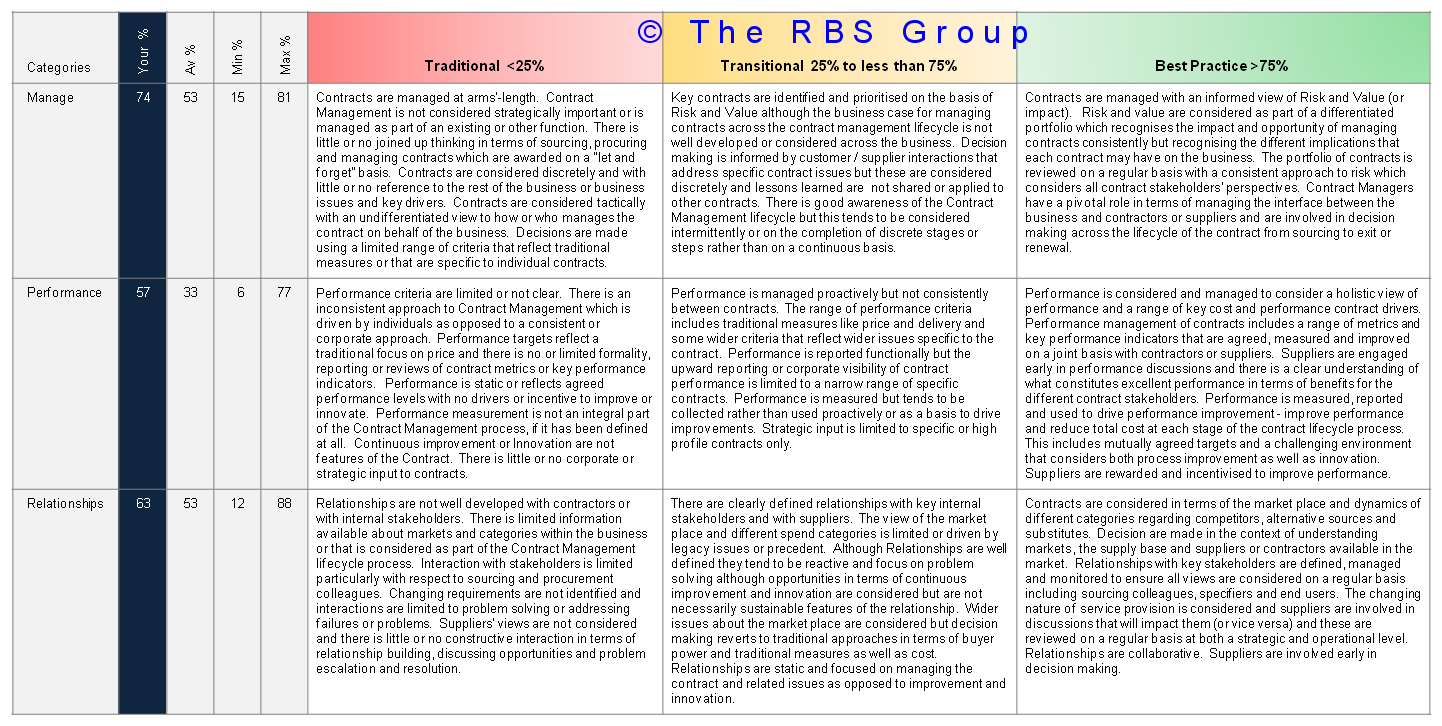 |
Manage, Performance & Relationships The individual reports provide feedback on your performance using the model structure. Each Category and Element provides a quantitative score and a qualitative assessment using a maturity grid approach that defines typical characteristics of businesses in terms of where they lie in relation to other participants and fall into each of the defined quartiles.
|
|
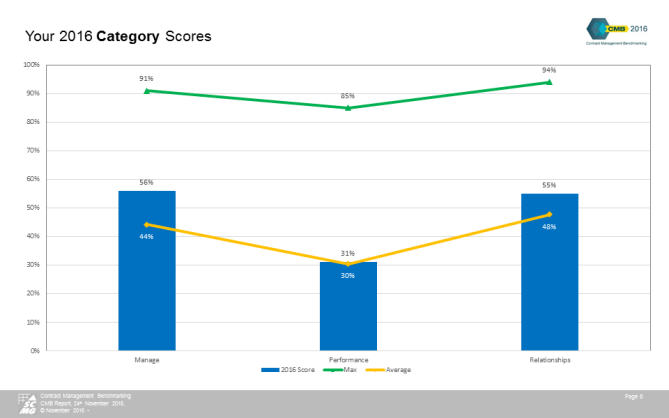
Categories and Elements Each Category comprises three Elements. Performance in each Element is also reported and the illustration shows performance against the maximum, minimum and average performance of all other participants for the three elements in one of the Categories. |
 |
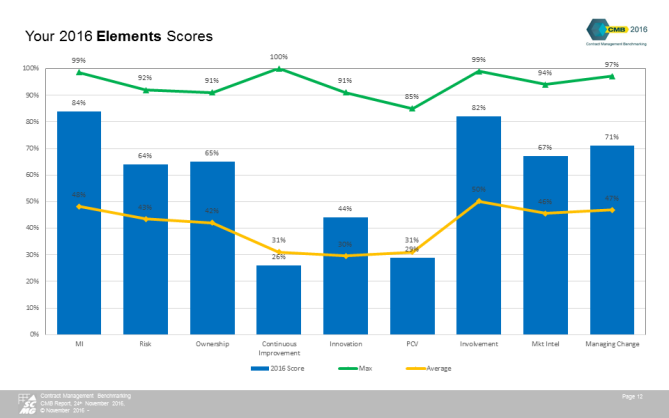 |
Summary Report Performance in all Elements is illustrated against the maximum, minimum and average performance for all participants. The graphical illustration provides an easy reference to identify where strengths and weaknesses exist versus a Best Practice approach.
|
|
The report will allow you to identify
strengths and weaknesses in your approach and inform where any
improvements or changes to your existing process can be made. |
||||
|
Participants Founder Member participants are: |
||||
|
|
|
|
|
|
|
|
|||
 |
The CMB Survey and contents are © SCMG.
CONTACT DETAILS |